Indicators
Indicators are mathematical calculations applied to price data that help you spot trends, momentum, volatility, and potential reversals. BrighterTrading has a wide range of built-in indicators that display directly on your chart.
Adding an indicator
- Open the Indicators panel in the right sidebar
- Click New Indicator
- Choose an indicator type
- Configure the parameters (period, colours, data source)
- The indicator appears on your chart
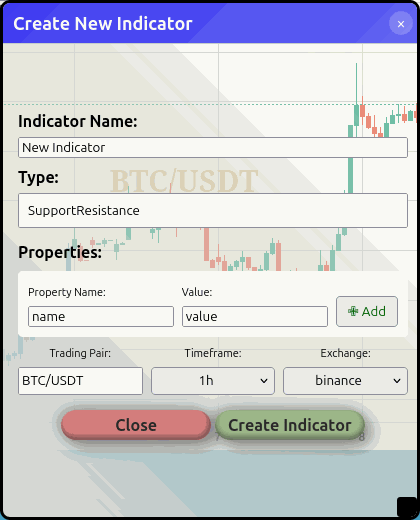 The indicator creation dialog — pick a type, configure the parameters, and it appears on your chart
You don't pick a name for an indicator. The platform generates a canonical name from the type, parameters, and data source — for example EMA(20) BTC-USDT 5m kucoin. This means two indicators with the same configuration will collapse into one shared row, and renaming an indicator down the road never breaks the strategies that reference it.
Identity is tracked under the hood by a stable id, not by the visible name, so the canonical label can be regenerated freely as your sources change.
Available indicators
Trend indicators
- SMA (Simple Moving Average) — Average price over a set number of periods
- EMA (Exponential Moving Average) — Like SMA but gives more weight to recent prices
- Supertrend — Trend-following indicator that flips between bullish and bearish
- Linear Regression — Statistical trend line fitted to recent price data
Momentum indicators
- RSI (Relative Strength Index) — Measures speed and magnitude of price changes (0-100 scale)
- MACD (Moving Average Convergence Divergence) — Shows the relationship between two moving averages
Volatility indicators
- Bollinger Bands — Upper and lower bands based on standard deviation from a moving average
- BOL%B (Bollinger %B) — Shows where price is relative to the Bollinger Bands (0 = lower band, 1 = upper band)
- ATR (Average True Range) — Measures market volatility
Price structure
- RollingHL (Rolling High/Low) — Tracks the highest high and lowest low over a rolling window
- PivotDetector — Identifies pivot highs and pivot lows in price action
- SupportResistance — Automatically detects support and resistance levels
Volume
- Volume — Displays trading volume as a histogram below the chart
Patterns
- Patterns — A submenu of candlestick pattern detectors
Multiple moving averages with the same period measure the same thing — adding a 20-period SMA, a 20-period EMA, and 20-period Bollinger Bands gives you one signal shown three ways, not three independent signals.
However, moving averages with different periods give genuinely different information. A common technique is comparing a fast average (e.g. 10-period EMA) against a slow one (e.g. 50-period EMA) to spot trend changes. See the Trading Concepts page for more on how indicators work.
Indicator settings
Each indicator has settings you can customise:
- Name — Auto-generated from the type, parameters, and data source. Display-only.
- Type — The indicator calculation. Display-only after creation; create a new indicator if you want a different type.
- Data source — Which symbol, timeframe, and exchange to calculate from. Pick from the dropdowns (defaults to your chart's current view).
- Parameters — Period length, multipliers, and other calculation inputs depending on the type.
- Colours — Customise how the indicator looks on the chart.
- Show on chart — Toggle visibility without deleting the indicator.
Editing an indicator
Click an indicator in the panel to open its edit dialog.
What stays the same row: colour changes, thickness changes, and the visibility toggle keep the indicator's identity. The dialog updates the single row in place.
What creates a new indicator: changing parameters (period, multiplier), or any field of the data source (symbol, timeframe, exchange). The platform treats those edits as a different indicator config:
- A new indicator row is created (or, if you've already configured a matching one elsewhere, the existing row is reused).
- Every strategy of yours that referenced the old indicator is automatically rewritten to point at the new one.
- The old indicator is deleted.
The whole operation is atomic — if anything fails partway, the change is rolled back and your old indicator and strategies stay intact. The edit will be refused if:
- A strategy currently running (paper or live) references the indicator. Stop those strategies first.
- A backtest is running for a strategy that references the indicator.
- A signal you own references the indicator by name. Update or delete that signal first; the dialog tells you which signal is blocking.
- The indicator is referenced by a published marketplace version of a strategy. Retract the version first — published snapshots can't be retroactively rewritten.
External indicators
BrighterTrading also supports External Indicators — data from external APIs that can be used alongside your chart. These pull historical data from third-party sources (like the Fear & Greed Index) and are particularly useful for backtesting strategies that incorporate market sentiment or other off-chain data.
Click + External Indicator to add one. You'll configure the API endpoint, authentication, JSONPath expressions for values and timestamps, and date formats. A Test Connection button lets you verify everything works before saving.
For the full configuration guide, see External Indicators.
External Indicators provide historical data arrays for backtesting. If you need live data for a running strategy, use External Sources instead (found in the Signals panel).