Using a Formation as a Strategy Circuit Breaker
The earlier tutorials encoded trade ideas in indicators — RSI, MACD, OI, sentiment readings. This one teaches a different pattern: drawing a chart formation by hand, and using it as a safety net rather than as a primary entry signal.
The hypothesis:
My primary strategy decides when to enter and exit. The formation tells me when the market regime has changed enough that the strategy shouldn't be trading at all.
If you've drawn a channel that price has respected for weeks, the moment price breaks out of that channel is the moment your "this trade idea works in this regime" assumption breaks. A circuit-breaker formation flat-out exits the strategy when that happens — no more entries, no more trades, until you re-evaluate.
- How to draw a channel formation (and an extra trendline) on a chart
- How indicators and formations from a higher timeframe show up in a strategy on a lower timeframe
- The difference between Close Position and Exit Strategy and close all trades — and why circuit breakers want the latter
- How to track position direction with flags so direction-aware closes don't accidentally fire when nothing is open
- Why flag resets after stop-loss / take-profit / liquidation matter
Why use a formation this way
Formations matter. Patterns do influence price, because enough traders watch the same shapes and trade them that the reaction becomes partly self-reinforcing. A channel holding for weeks isn't superstition — it's the residue of a lot of buyers stepping in near the lower line and a lot of sellers fading the upper one.
What's hard is knowing which pattern is operative at any given moment:
- You can't see other traders' timeframes. Your 1h channel might be invisible to someone trading the 15m, and a daily trendline you don't have drawn might be the level whales are defending.
- The same price action hosts multiple patterns at once. A cup and handle can be read as a W or a double bottom; either can be read as an inverse head and shoulders; all three can sit inside a larger triangle — and the readings often carry opposite biases.
- Patterns are fractal. Zoom into the pivots of a daily channel and you'll find cups, flags, and miniature triangles forming and resolving inside it. The "true" pattern depends on the scale you're looking at.
- Forming and breaking are different events. A clean channel that's held five times can hold a sixth or fail on the next touch — same chart, no warning. The pattern doesn't carry timing information.
So formations don't make great standalone entry signals: too much is unknowable about which interpretation is dominant, and the patterns don't tell you when. Where they earn their keep is as levels and regime context — a price zone other traders are likely watching, with a defined point at which your "this is the regime" assumption is wrong.
That's the shape of a circuit breaker. The formation isn't predicting the next move; it's defining "the regime I think I'm trading in," with an explicit exit. When price leaves that regime, the strategy steps back until you re-evaluate.
This separates concerns:
- Primary strategy (RSI + EMA on 5m): decides which entries have positive expectancy given the current regime.
- Formation (channel on 1h): defines what counts as "the current regime" and where it ends.
If the primary edge is real, the formation rarely fires. If the regime changes, the formation fires before the primary strategy can rack up losses against the new conditions.
Step 1: Draw the formation
Find a clean channel on whatever timeframe you're comfortable analyzing — for this tutorial, ETH/USDT 1h. Click the ═ Channel button under Draw Formation in the right panel and place the four anchor points: two for the upper line, two for the lower line.
Optionally, draw a separate ━ Line through any other level inside the channel that you've seen price respect — a previous range high, a value-area edge, a custom mid-point. The Channel formation gives you upper, lower, and a geometric midline automatically; a custom Line lets you reference an off-center level the channel doesn't expose.
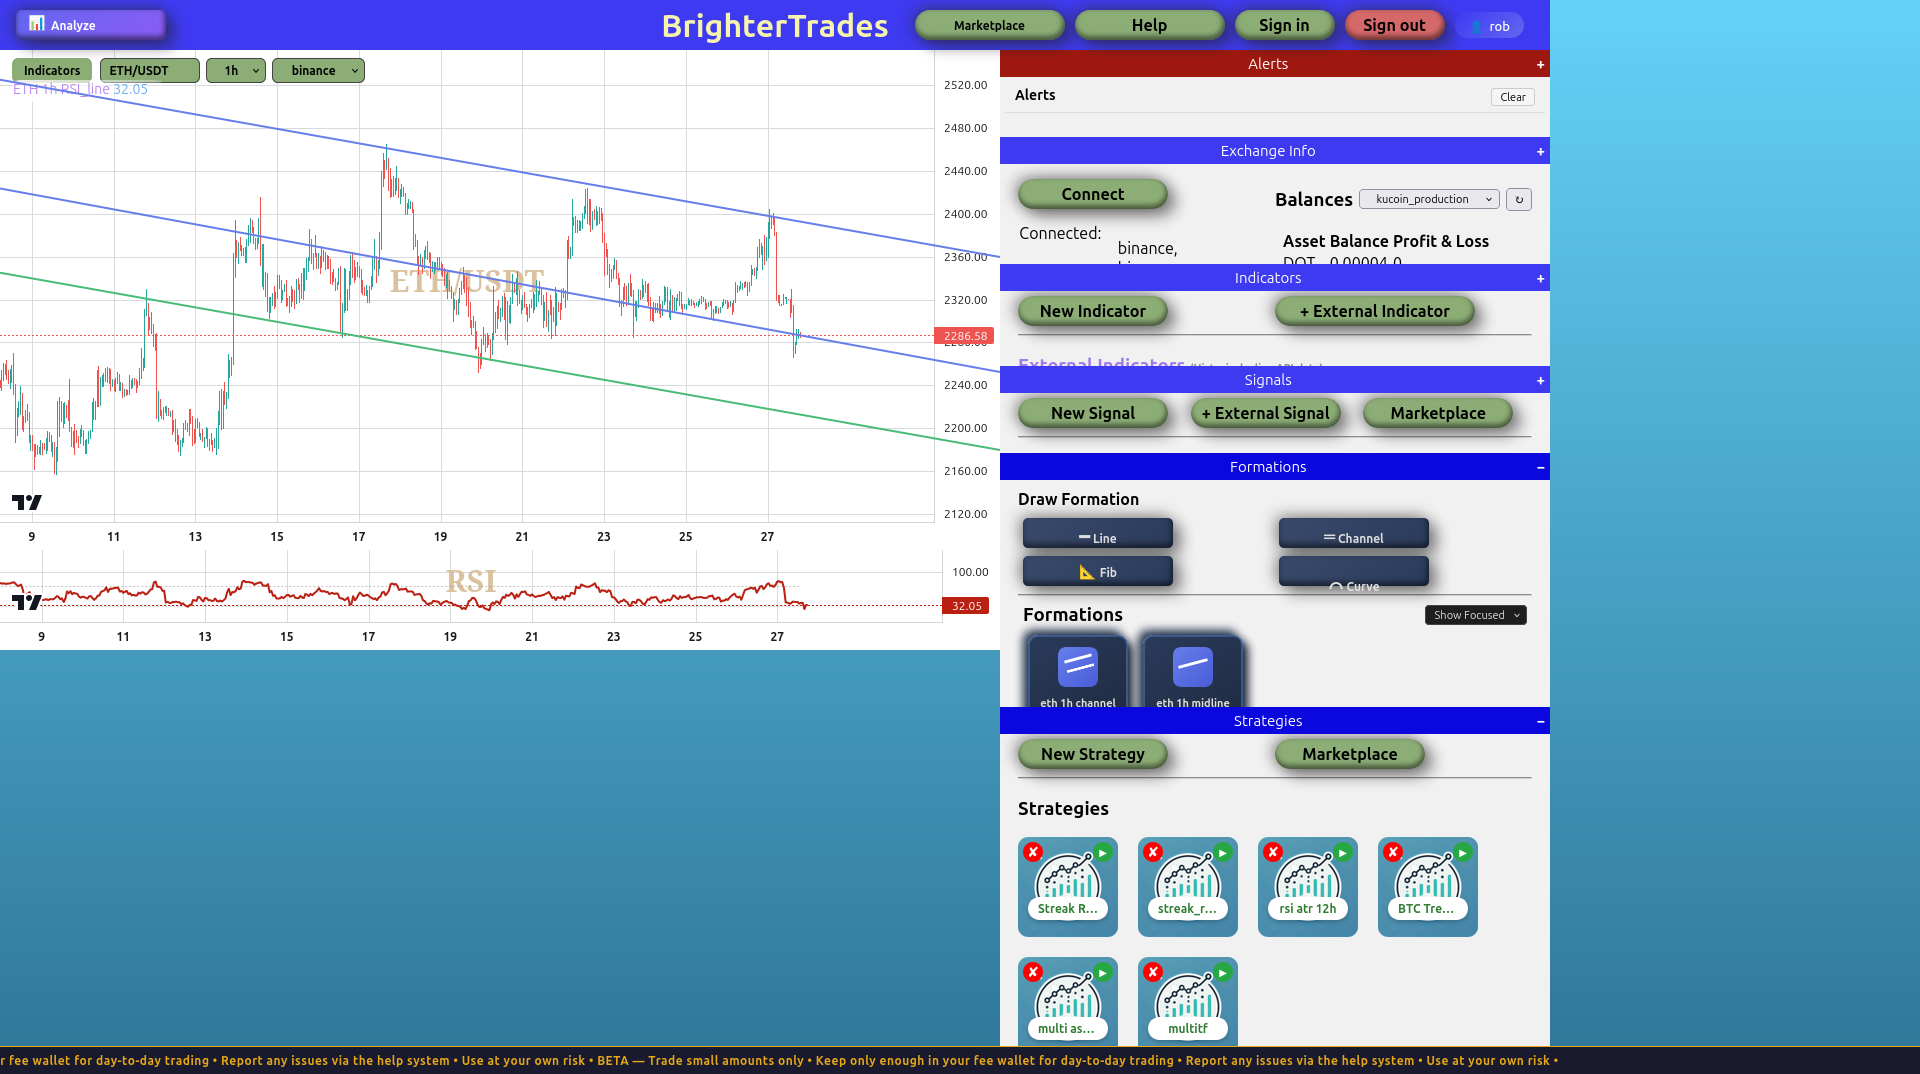
Name them clearly — eth 1h channel and eth 1h midline — so they're easy to reference in the strategy.
Step 2: Set up the primary strategy ingredients
Switch to the timeframe you'll execute on (this tutorial uses 5m). In the right panel, create the indicators your primary strategy needs:
| Indicator name | Type | Trading Pair | Timeframe |
|---|---|---|---|
ETH 5m RSI | RSI (default 14) | ETH/USDT | 5m |
ETH 5m EMA 20 | EMA period 20 | ETH/USDT | 5m |
These are the entry/exit signals. The 1h channel will only ever be referenced as a circuit breaker.
Step 3: Generate the strategy
Click New Strategy → Generate with AI. A reasonable prompt:
Trade ETH/USDT on the 5m timeframe. Use ETH 5m RSI and ETH 5m EMA 20 for the primary strategy, and use the formation "eth 1h channel" purely as a safety exit (circuit breaker), never as an entry signal.
Primary entries — only one position at a time:
- Open LONG when ETH 5m RSI value is below 30 AND current price is above ETH 5m EMA 20 value
- Open SHORT when ETH 5m RSI value is above 70 AND current price is below ETH 5m EMA 20 value
Primary exits — RSI returning to the midline:
- Close LONG when ETH 5m RSI rises above 50
- Close SHORT when ETH 5m RSI falls below 50
Safety exits — formation broken:
- Close any LONG position if current price falls below the formation "eth 1h channel" Output lower
- Close any SHORT position if current price rises above the formation "eth 1h channel" Output upper
Risk management on every entry: 1% stop loss, 2% take profit, 5% of equity, futures 1× leverage.
Set Default Trading Source to ETH/USDT, 5m, binance at the bottom of the dialog before clicking Generate.
Step 4: Adjust the generated strategy
The first-pass output will be close, but it almost always needs three structural fixes before it backtests cleanly. They're worth understanding because the same patterns come up in every strategy with multiple exit conditions.
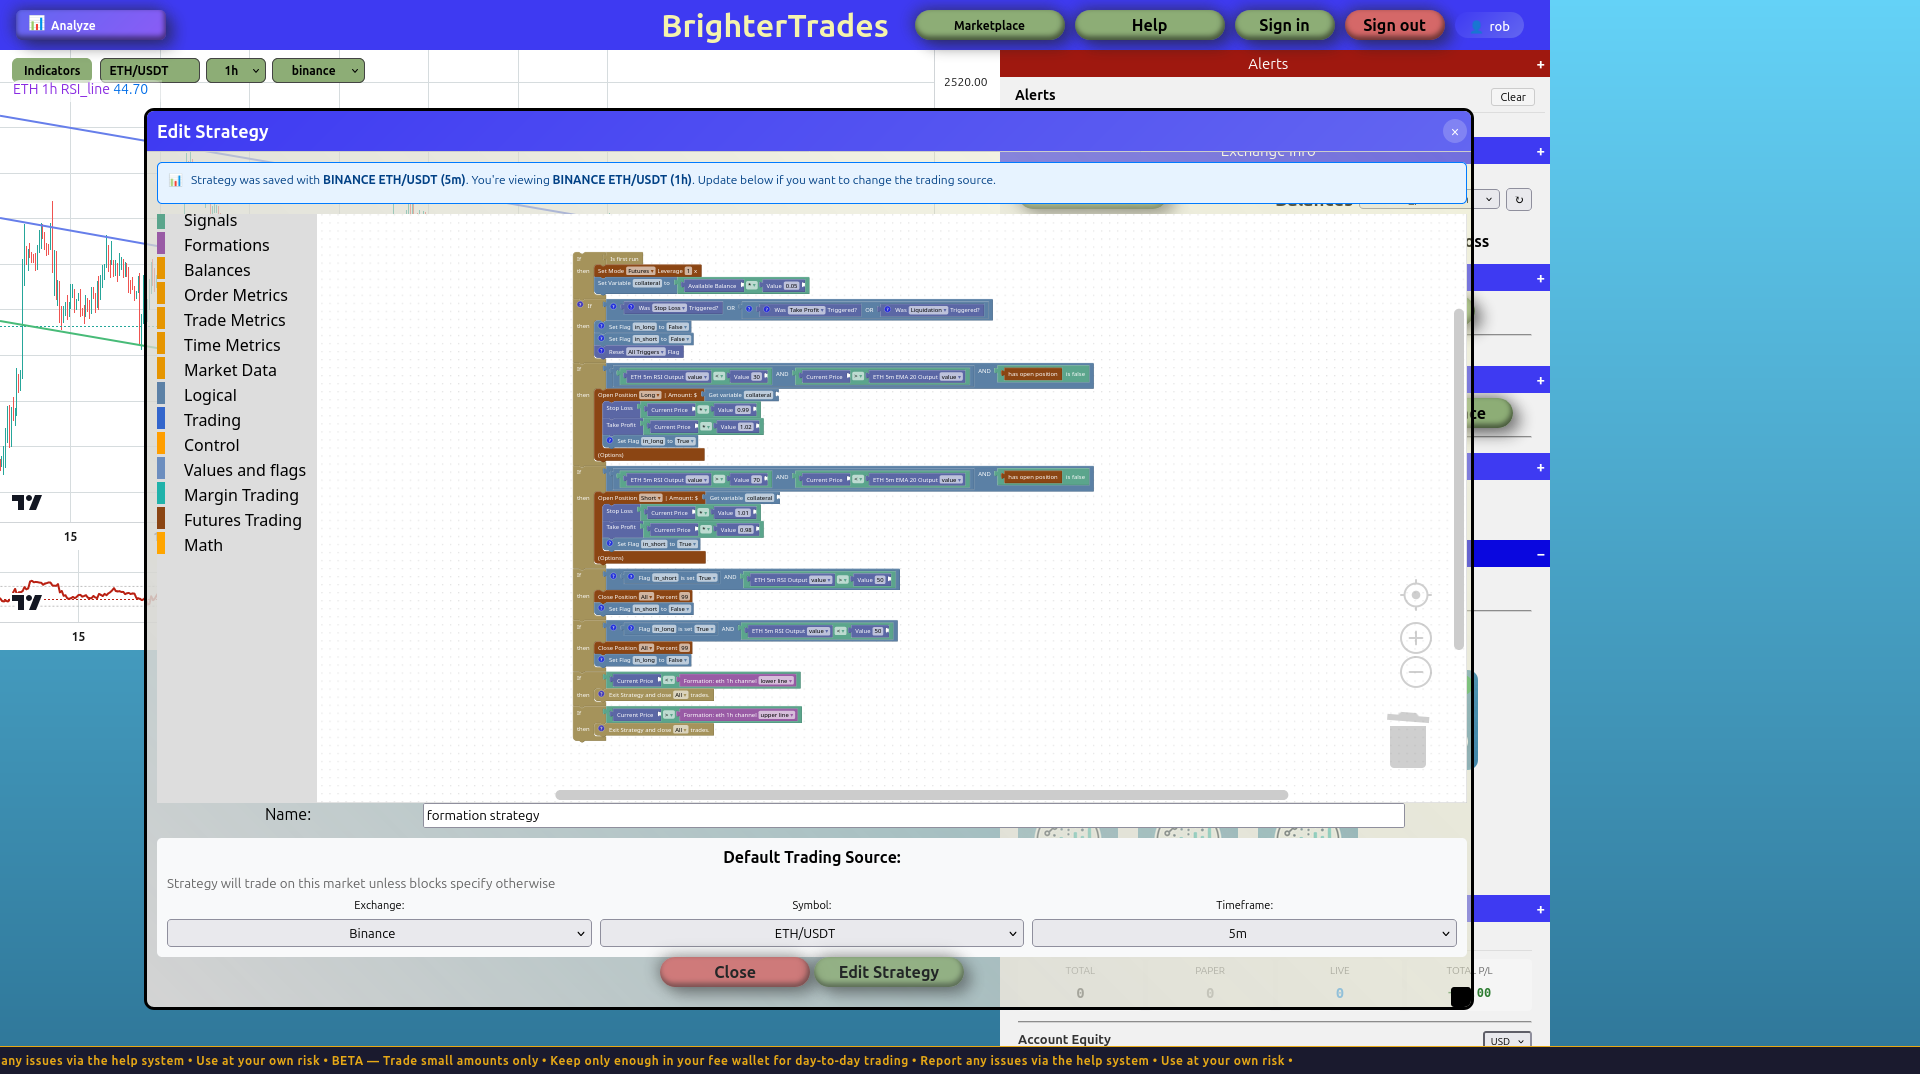
4a — Track position direction with flags
Long and short use different exit conditions on the same RSI value, and RSI alone doesn't encode which side is open — so the strategy needs flags to remember. We'll use two: in_long and in_short. Flags default to false, so no explicit initialization is needed.
In each entry branch, after Open Position, add Set Flag in_long to true (for the long branch) or Set Flag in_short to true (for the short).
In each primary-exit branch, gate the Close Position on the matching flag:
- Long exit:
If in_long is set true AND ETH 5m RSI > 50 → Close Position, Set Flag in_long false - Short exit:
If in_short is set true AND ETH 5m RSI < 50 → Close Position, Set Flag in_short false
Without the flag check, the close branches fire whenever RSI is on the right side of 50 regardless of whether anything's open. You'll see a flood of FUTURES CLOSE FAILED: No futures position found warnings in the backtest log.
4b — Use Exit Strategy and close, not Close Position, for circuit breakers
The formation safety exits should not just close the position — they should halt the strategy. The reason:
If a Close Position block fires when the formation breaks, the next tick the strategy still evaluates entry conditions. Whenever those conditions next satisfy, the strategy opens a new position — and on that same tick (or the next one), the circuit-breaker fires again because price is still outside the formation, closing the new trade. As price drifts further from the broken formation, this enter-then-immediately-close loop keeps repeating, bleeding fees and slippage on every cycle.
Replace each formation-break branch's Close Position with an Exit Strategy and close all trades block (in the Trading category). That block terminates the strategy entirely — no more entries, no more anything — until you manually restart it. Which is exactly what you want when your regime assumption has just been invalidated.
4c — Reset flags when the position closes externally
Stop loss, take profit, and liquidations close positions without running through your strategy's close branches. They happen on the exchange between ticks. So if a long is opened, in_long is set true, then the stop loss fires and closes the position — in_long is still true. Next time RSI < 30 fires, the long entry condition checks not has_position (passes, no position) but the close branch later still sees in_long is set true and tries to close a position that no longer exists. More CLOSE FAILED warnings.
Put a flag-cleanup block at the start of the strategy, before any condition evaluation:
If has_position is false:
    Set Flag in_long to false
    Set Flag in_short to false
It needs to run before the entry/exit logic so the flags reflect the current exchange state for the rest of the tick. If you put it at the end instead, that tick's logic still sees stale flag values and can try to close a position that the exchange already closed.
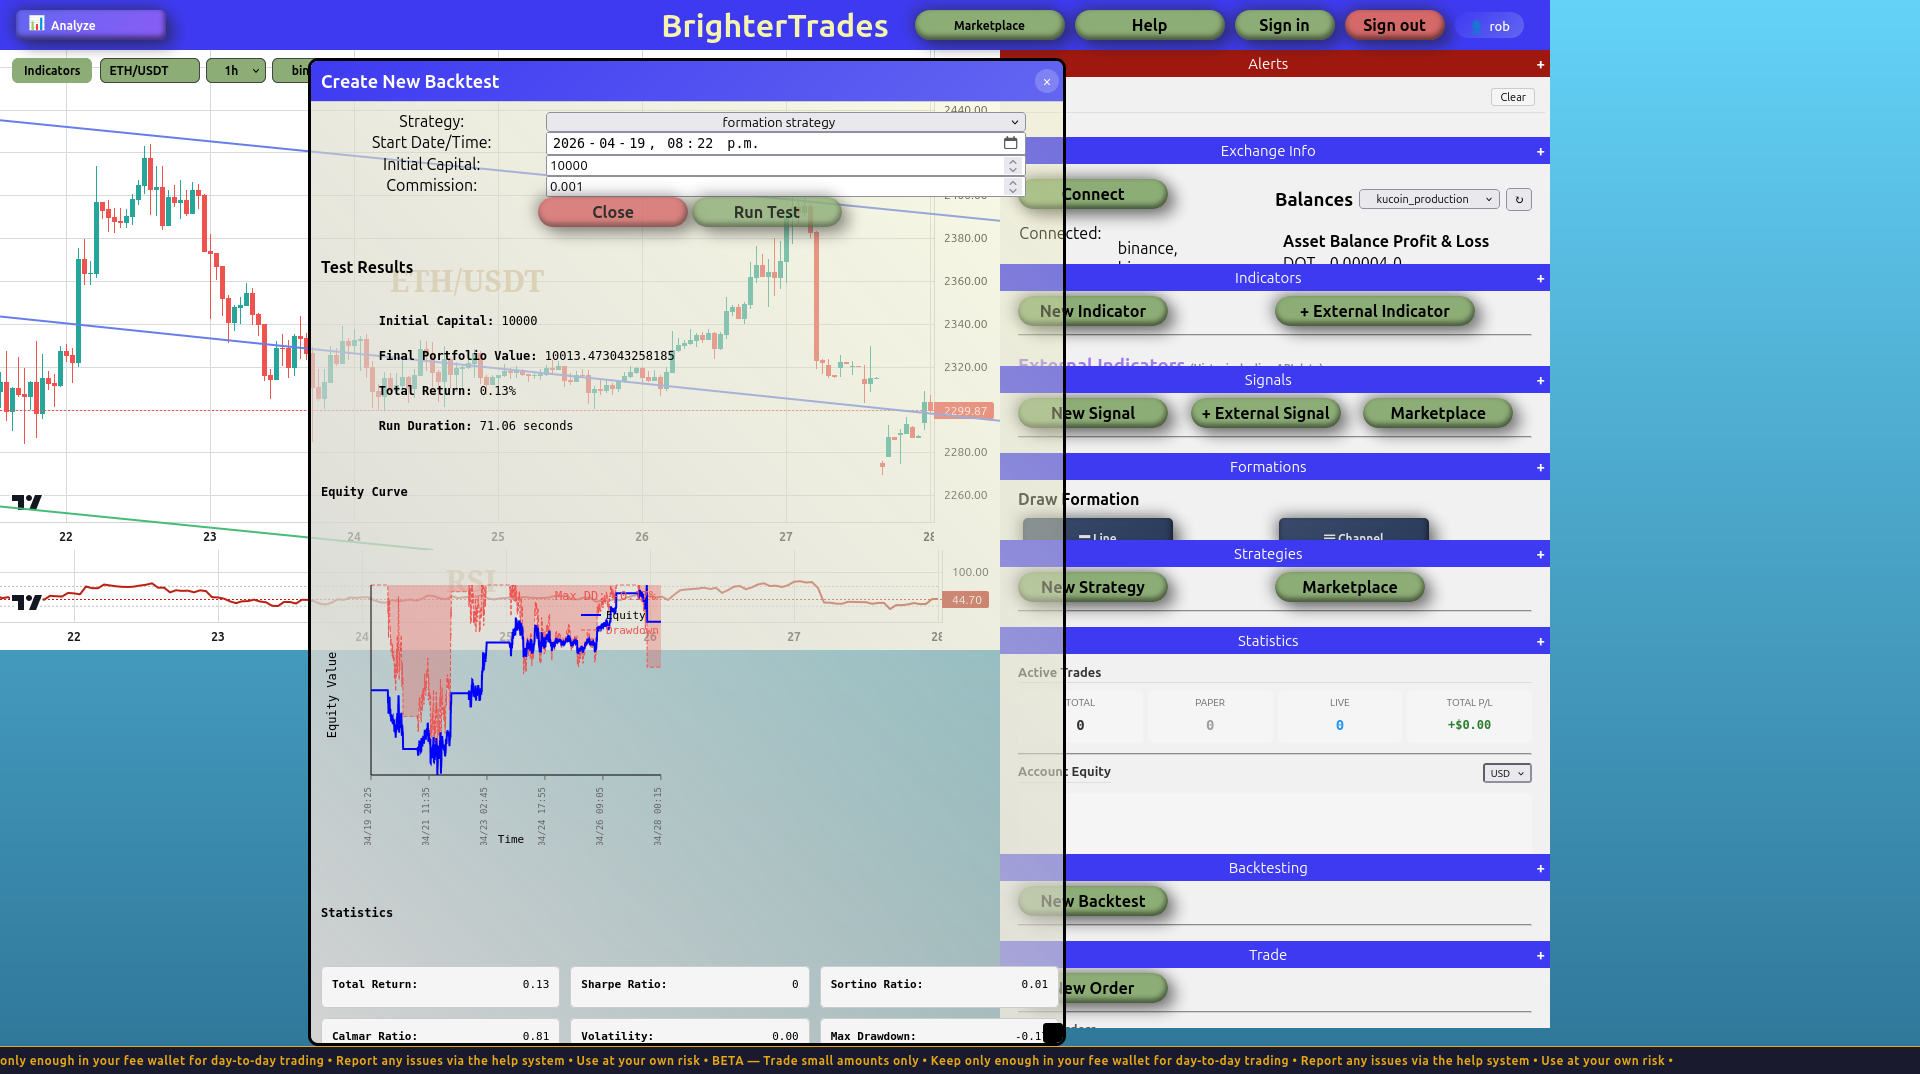
Step 5: backtest it
Run the backtest from a recent date that's still inside the channel's validity. Look for these in the trade log:
- Are there
CLOSE FAILED: No futures position foundwarnings? If yes, the flag logic from step 4a or 4c isn't catching every case. Walk back through. - Did the strategy actually exit when the formation broke (if it did during your test window)? If the channel broke during the test and the strategy continued trading after, the circuit breaker isn't wired right. Check that the safety-exit branches are using Exit Strategy and close, not Close Position.
- Does the equity curve actually do anything? If trades fire but P&L is flat or slightly negative, the primary strategy has no edge — that's a strategy-design problem, not a wiring one. Try widening RSI thresholds (e.g. 25/75 instead of 30/70) or using different indicators for entries.
A clean backtest result on a strategy that isn't broken structurally:
When this pattern is useful — and when it isn't
The formation-as-circuit-breaker pattern earns its keep when:
- Your primary edge is real. The formation just keeps you out of regime changes that would invalidate the edge. If the primary strategy is mediocre, no formation can save it.
- You can articulate "what regime is this?" A clean channel, range, or trendline that's held for weeks gives you a defensible answer. Drawing four lines on noisy data and calling it a regime gives you nothing but false comfort.
- You're willing to actively maintain the formation. Channels move, break, and re-form. A formation drawn six months ago and forgotten is worse than no formation at all — your strategy is now flat-out anchored to a regime that no longer exists.
It earns less when:
- The "regime" is just whatever shape recent data happens to make. If you have to squint to see the channel, your strategy will inherit your squinting.
- Your strategy already has tight risk management (small SLs, ATR-based sizing). A formation safety net adds little when individual trades are already well-bounded.
The version of formations that works for you long-term is one where you redraw or retire formations as part of your weekly routine, not one you set-and-forget.