Building a Futures Strategy by Hand
In this tutorial we're going to do what the Trading Mindset page said traders should do: observe a pattern, form a testable rule, and actually test it. No hand-waving. No "this setup has a 90% win rate" nonsense. Just a concrete strategy we'll build from scratch, backtest with real historical data, and then iterate on — honestly.
- How to turn a chart observation into a specific, testable strategy
- How to build a strategy by hand using the visual block editor
- How the
is_first_runblock handles one-time initialization cleanly - How to express streak-and-reversal logic with a stateful flag
- How to wire a futures order with leverage, collateral, stop loss, and take profit
- How to read a backtest report — what the numbers actually mean
- How to iterate on a strategy when the first version isn't profitable
- The difference between an in-sample tweak and an out-of-sample test — and why both matter
Why build by hand?
BrighterTrading has a Generate with AI button in the strategy dialog that will build a strategy from a plain-English description. It's a real time-saver once you know what you're doing. But this tutorial deliberately avoids it, because:
- Understanding comes from doing. If you can't build a strategy by hand, you can't debug one the AI built.
- You learn what blocks exist. The toolbox has more than a dozen categories. You won't discover half of them unless you go looking.
- You learn the patterns. Every strategy you write will repeat certain shapes — initialization blocks, entry conditions, risk management, state tracking. Doing it once by hand burns them into muscle memory.
Once you've done this tutorial, the AI generator becomes a useful collaborator rather than a black box.
The observation
We're on BTC/USDT, Binance, 12h timeframe. Here's what we're looking at:
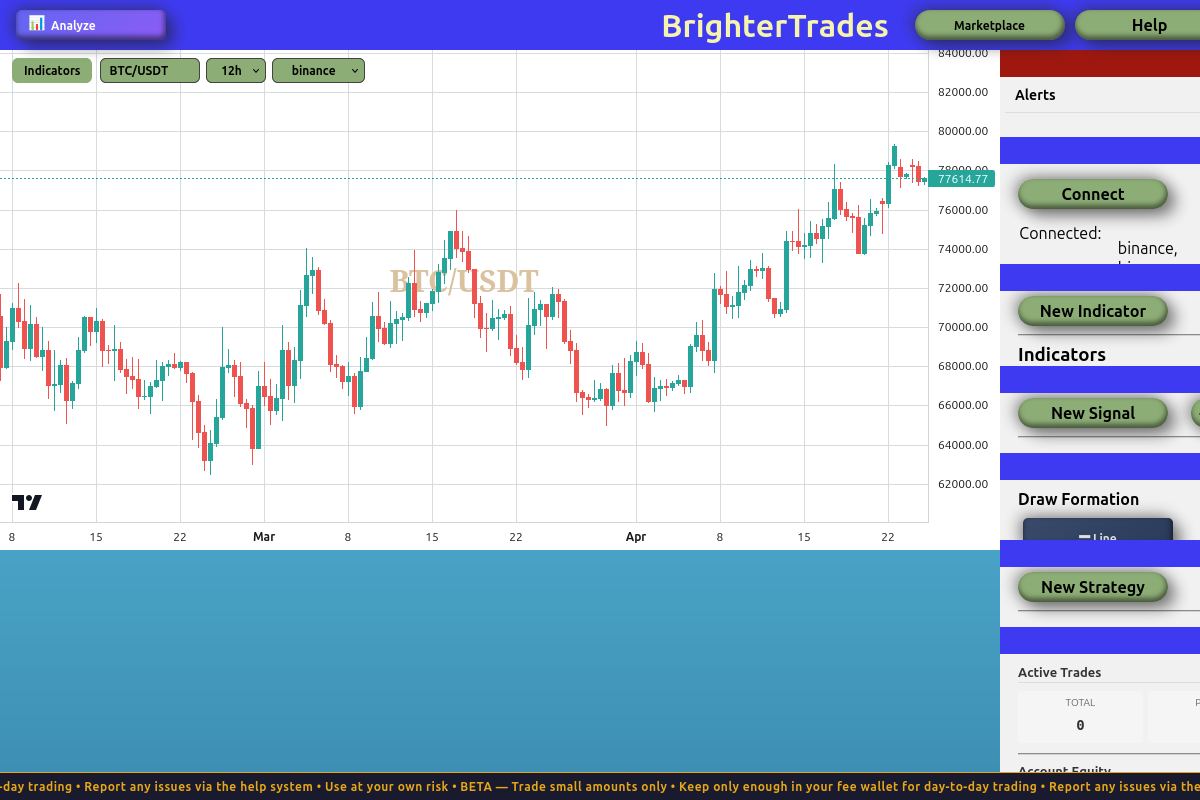
The 12h BTC/USDT chart shows a recurring pattern: clusters of green candles followed by clusters of red ones. This "streak and reversal" behaviour is what we want to exploit.
Take a moment to look at it. Notice the clusters. Notice that after a run of green candles, the first red candle is often followed by more red candles — not just one. And after a run of reds, green tends to come back.
Markets often show short-term momentum. Streaks of the same-coloured candles happen more often than pure randomness would predict. Whether exploiting that momentum is profitable after fees is a different question — which is exactly why we backtest.
The hypothesis
Our observation gives us a concrete, testable rule:
After at least 2 green candles in a row, when the next candle closes red, short at the close of that red candle. Place a stop loss above the red candle's high and a take profit below the entry by some multiple of the candle's volatility.
In plain English:
| Entry | Short at the close of the first red candle following 2+ greens |
| Stop loss | Above the red candle's high, sized by volatility |
| Take profit | Below the entry, sized by volatility, larger than the stop |
| Leverage | 10× |
| Collateral | 5% of available balance |
We'll start with the candle's own range as our volatility measure, then later swap in ATR (average true range) — a smoother, multi-candle volatility estimate.
A red candle after a green streak can be read two ways:
- Mean reversion — "the trend is exhausting, short it." (This is our hypothesis.)
- Trend continuation — "that red is just a pullback; the uptrend resumes, buy the dip."
Both interpretations exist in real markets. Which one is right for BTC 12h? We don't know yet. That's the whole reason we backtest.
Opening the strategy builder
Open the Strategies panel in the right sidebar, and click New Strategy.
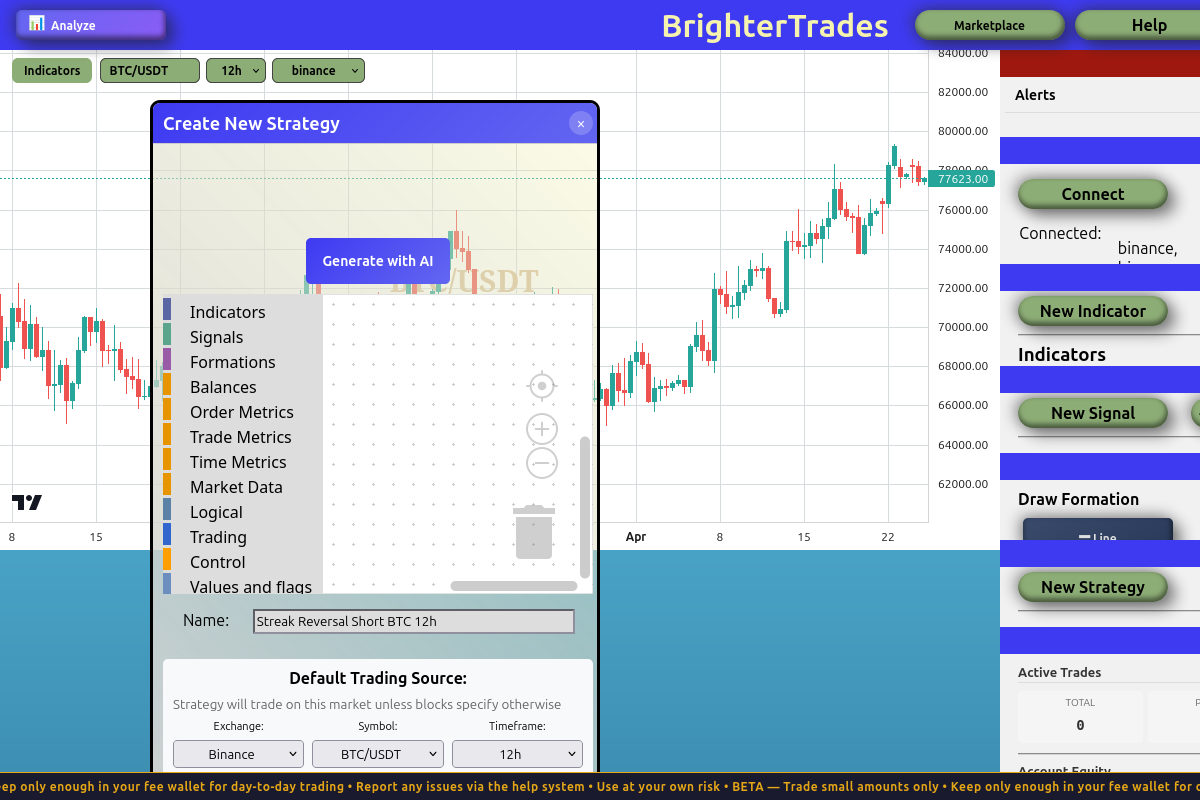
The strategy dialog as it opens. Name it something descriptive — we used "Streak Reversal Short BTC 12h". Notice the exchange, symbol, and timeframe are already pre-filled to match the chart you were looking at.
Before you start dragging blocks, set up your workspace:
- Move the dialog to the left side of the screen by clicking and dragging its header
- Resize it larger by dragging the bottom-right corner outward
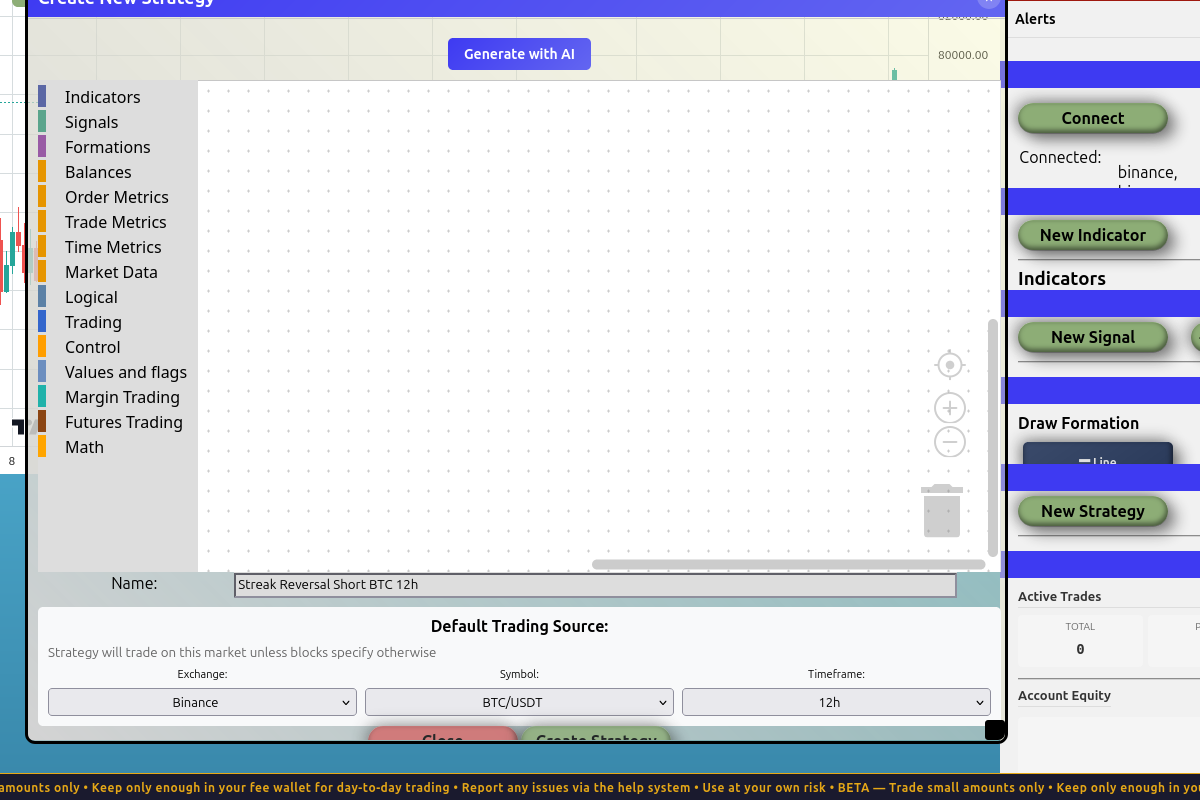
A bigger canvas makes block assembly much less cramped. Do this every time.
Most people skip the resize step. Don't. The default canvas is small, and once you've got six or seven blocks nested together, you'll be scrolling constantly. Expand first, build second.
Step 1: The initialization block
A well-written strategy has two phases:
- Initialization — runs once, on the very first tick. Sets up constants: trading mode, leverage, collateral sizing.
- Per-tick logic — runs every tick. Checks conditions, places trades, updates state.
BrighterTrading exposes a special boolean block called Is first run that returns true on the strategy's first tick and false after. Plug it into an execute_if and you have a clean one-time setup hook.
The pseudocode:
if is_first_run:
    Set Mode Futures, Leverage 10x
    collateral = available_balance × 0.05
Building the init block
- From Control, drag out an
If ___ then(execute_if) block onto the canvas. - From Control, drag the
Is first runblock and plug it into theIf's condition slot. - Inside the
If's body, in this order:- From Trading, drag
Set Mode ___ Leverage ___ x. Set the dropdown to Futures and the number to 10. - From Values and Flags, drag
Set Variable ___ to ___. Rename the variable to collateral. - From Math, drag the arithmetic block (
a × b) into the variable's value slot. Operator:×. - From Balances, drag
Available Balanceinto the left side of the multiplication. - From Values and Flags, drag a
Valueblock into the right side of the multiplication, and edit it to0.05.
- From Trading, drag
When you're done, your init block should look like this:
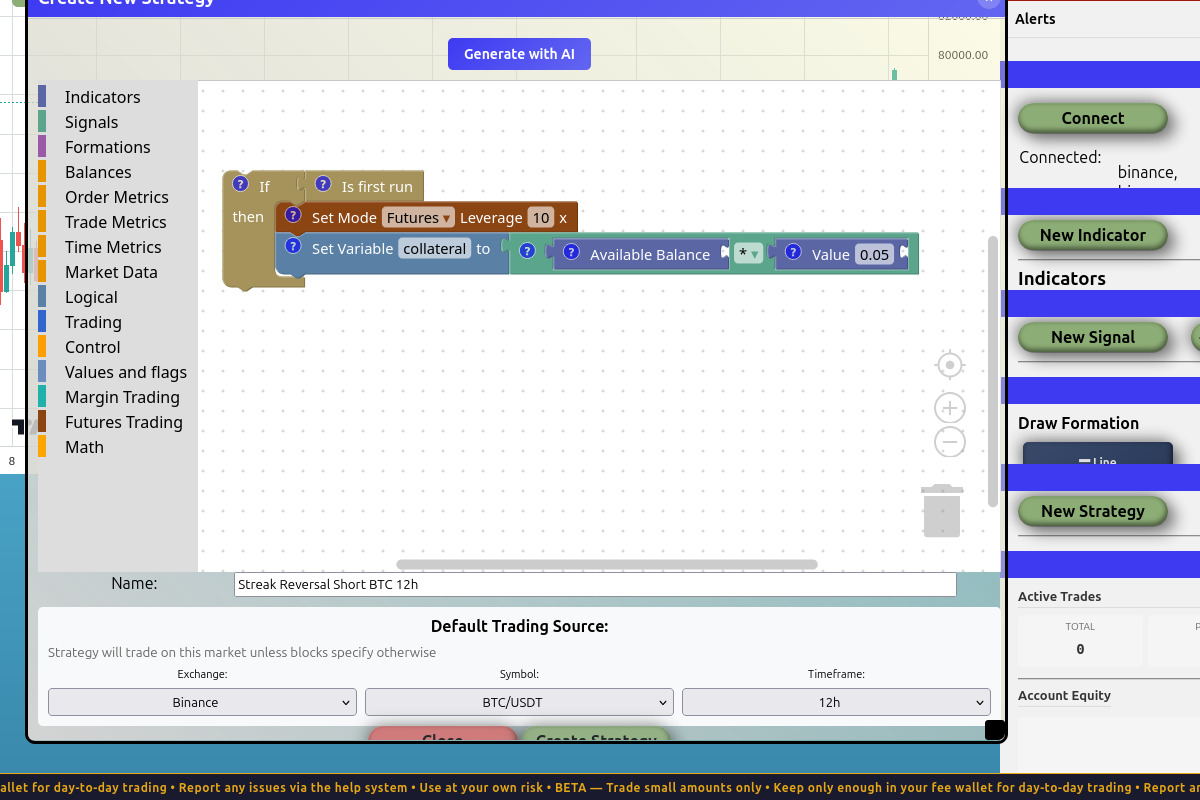
The full initialization: wrapped in an If [Is first run] check, sets futures leverage to 10x, then sets collateral to 5% of available balance. Runs once, on the first tick. Skipped every tick after.
We use available_balance × 0.05 instead of a hardcoded $100 because percentages scale with the account size. A strategy that's profitable on $10k should also be profitable on $100k or $1M without any code changes. Risk management with fixed dollar amounts breaks down at the extremes.
Step 2: The streak detector
Now for the per-tick logic — the part that runs on every closed candle and decides whether to trade.
Our condition: the last 2 candles were green, and the current candle just closed red.
You might be tempted to write this directly:
if last 2 candles all Green AND current candle is Red:
    short
But there's a contradiction. The "last 2 candles" check includes the current (most recently closed) candle. So last 2 candles all Green requires candle 0 to be green, but current candle is Red requires candle 0 to be red. Both can't be true at the same time, and the strategy would never fire.
There are two ways to resolve this:
- Look back further with explicit candle offsets — check candles 1 and 2 are green AND candle 0 is red.
- Use a flag — on each tick, remember whether the previous tick saw a 2-green streak. On the next tick, check the flag AND the new candle's colour.
We'll use the flag approach. It teaches a pattern you'll reuse: stateful logic that carries information across ticks.
The pseudocode:
# Each tick:
# 1. Check trade condition (uses flag set on the *previous* tick)
if green_streak flag is True AND current candle is Red AND no position open:
    place the short

# 2. Reset the flag — we'll re-set it below if the streak is still alive
green_streak flag = False

# 3. If the last 2 candles are green right now, set the flag for next tick
if last 2 candles all Green:
    green_streak flag = True
The trade check must come before the reset and re-set. If you do it the other way around, the flag reflects the current tick's streak — and you're back to the contradiction.
Resetting the flag to False and then conditionally setting it to True keeps the flag accurately reflecting "is the streak alive right now". Without the reset, the flag would stay True forever once set. This is a useful general pattern for any flag that should track current state, not historical state.
Building the trade-check block (Stack 2)
Drag a fresh If ___ then (execute_if) onto the canvas, below your init block. The condition is a chain of three ANDs:
- Flag is set: From Values and Flags, drag
Flag ___ is set ___. Name itgreen_streak, valueTrue. - Current candle is red: From Market Data, drag
Candle [0] bars ago is [Red]. The0means the most recently closed candle. - No position open: From Logical, drag
is false. From Trading, draghas open positioninto its slot.
Wire all three into a logical_and chain. The body of this If is where the trade goes — we'll fill it in next.
Building the flag bookkeeping (Stack 3)
Below the trade block, place these in order:
- From Values and Flags, drag
Set Flag ___ to ___. Namegreen_streak, valueFalse. This is the unconditional reset. - From Control, drag another
If ___ then. - From Market Data, drag
Last [2] candles all [Green]into its condition slot. - Inside the
If's body, drag anotherSet Flag green_streak to True.
Now you have three top-level stacks: init, trade-check, flag-bookkeeping. The vertical order on the canvas determines execution order, so make sure they're laid out top-to-bottom in that exact sequence.
When you have multiple disconnected top-level stacks, BrighterTrading executes them in top-to-bottom visual order. If you rearrange the stacks, you change the program. If you want execution order to be unambiguous, chain the blocks together — connect the bottom of one stack to the top of the next so they form a single continuous block. We'll do that at the end.
Step 3: The trade body
Inside the trade-check If (Stack 2), we need to:
- Compute the stop loss price
- Compute the take profit price
- Open a short futures position with both attached
For now we'll use the trigger candle's own range (high − low) as our volatility measure. We'll improve this with ATR in the next section.
The math:
candle_range = high − low(of candle 0, the trigger red candle)sl_price = high + candle_range(one full range above the high)tp_price = close − 2 × candle_range(two full ranges below the close — a 1:2 risk-reward)
Building the trade body
Inside the trade If's body:
-
Compute candle_range:
Set Variable candle_range to ___- In the value slot:
Math: a − b - Left:
Candle [0] bars ago value [High] - Right:
Candle [0] bars ago value [Low]
-
Compute sl_price:
Set Variable sl_price to ___Math: a + b— left isCandle [0] bars ago value [High], right isGet variable candle_range
-
Compute tp_price:
Set Variable tp_price to ___Math: a − b— left isCandle [0] bars ago value [Close], right is a nestedMath: a × bwithValue 2andGet variable candle_range
-
Open the short:
- From Trading, drag
Open Position. Set side to Short. - For the amount, drag
Get variable collateral. - In the options chain, attach
stop_loss(withGet variable sl_price) andtake_profit(withGet variable tp_price).
- From Trading, drag
When you're done, your trade body looks like this (the variables are computed, then the order is placed using them):
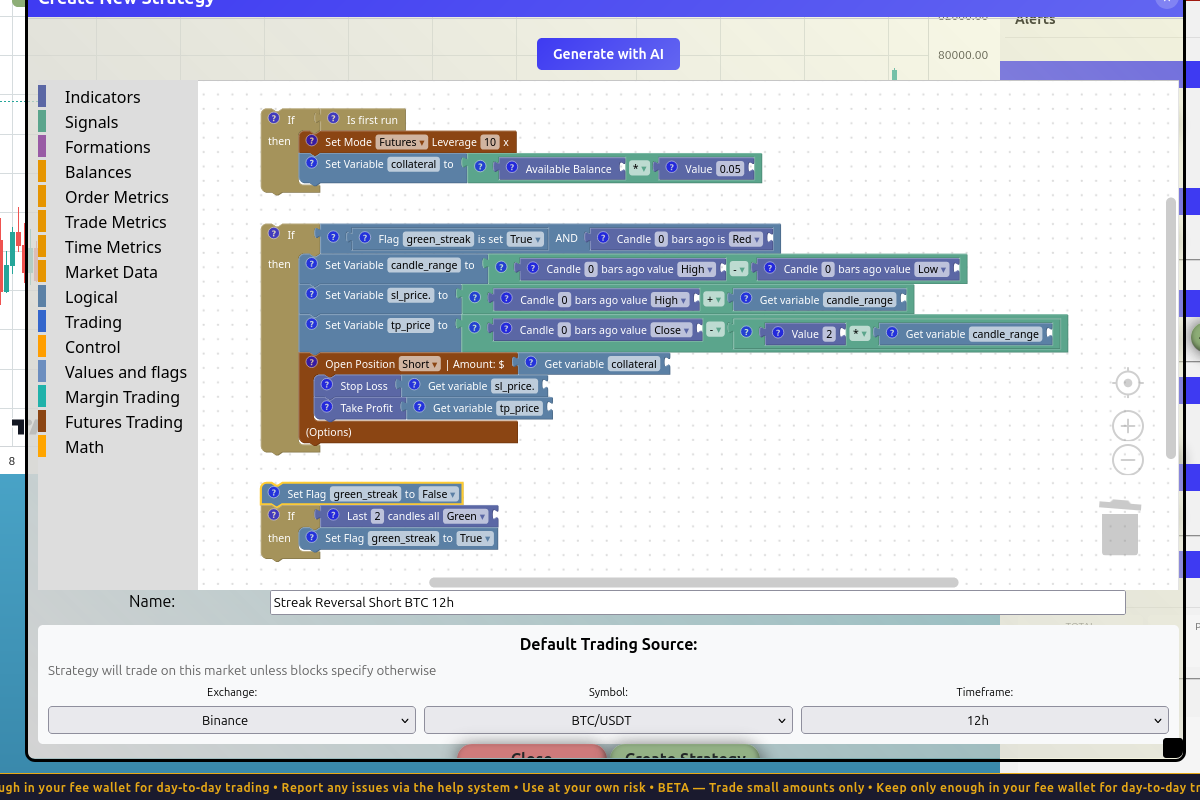
The full trade block: compute candle_range from the trigger candle's high − low, derive sl_price and tp_price from it, then open a short with both attached.
You could nest all the math directly inside the Open Position block's stop_loss and take_profit slots. We chose to store them in named variables first because:
sl_priceandtp_pricedescribe what the value means, making the strategy easier to read- If something goes wrong, you can inspect the variables in the backtest log
- If you want to use the same value in two places (e.g. logging both), you only compute it once
Chaining the stacks together
Right now we have three separate stacks. Their order matters, and there's no UI cue telling you that. The cleanest fix: chain them. Connect the bottom of the init stack to the top of the trade stack, and the bottom of the trade stack to the top of the flag-bookkeeping stack. Now you have one continuous block, and execution order is physically encoded.
The full strategy as a single chain: init → trade-check → flag-reset → flag-set. Each section is its own coloured block group, but they're all wired in the order they execute.
Click Create Strategy at the bottom of the dialog. The dialog closes; the strategy appears in the Strategies panel on the right.
Running the first backtest
Open the Backtesting panel (below Strategies and Statistics in the right sidebar — you may need to scroll). Click New Backtest.
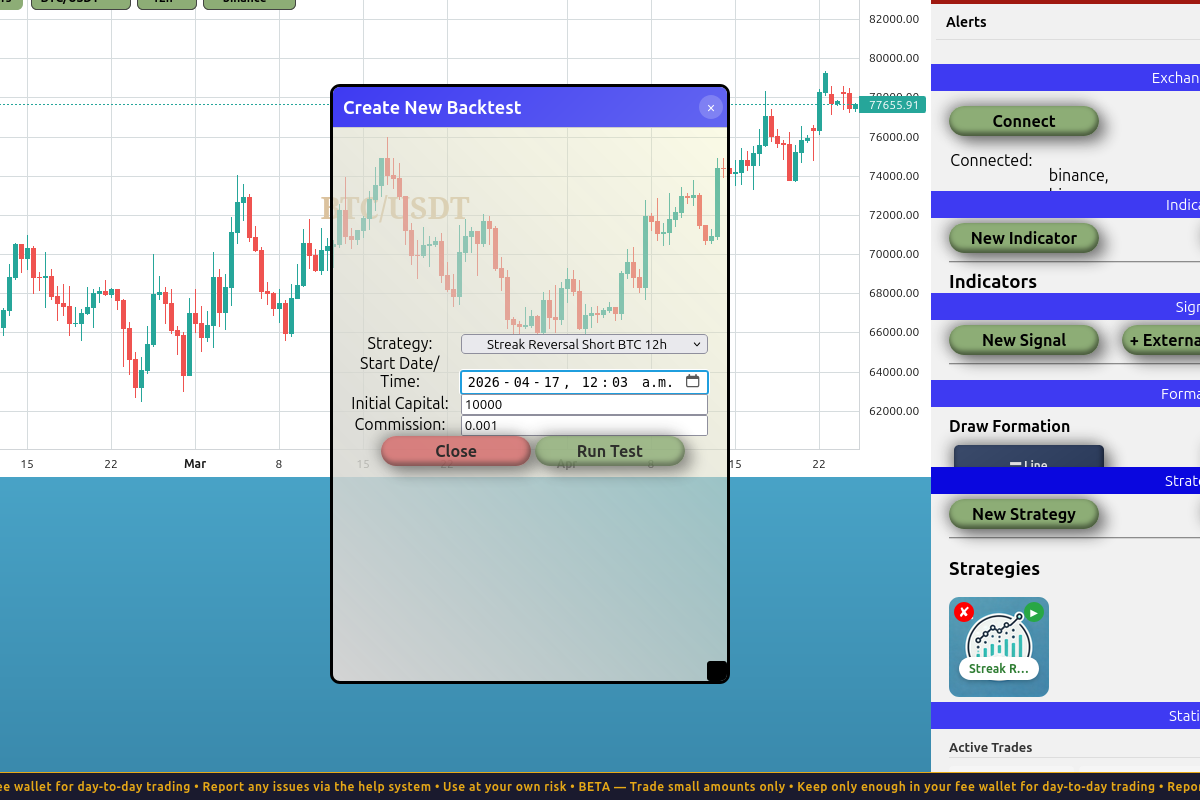
The backtest dialog. Strategy is pre-selected. Set a start date that gives the strategy enough data to fire multiple times — for 12h candles on a 4-month period, ~180 bars, plenty of opportunities.
Settings:
- Start Date/Time:
2026-01-01T00:00 - Initial Capital:
$10,000 - Commission:
0.001(0.1% — matches typical exchange reality)
Click Run Test.
Reading the results
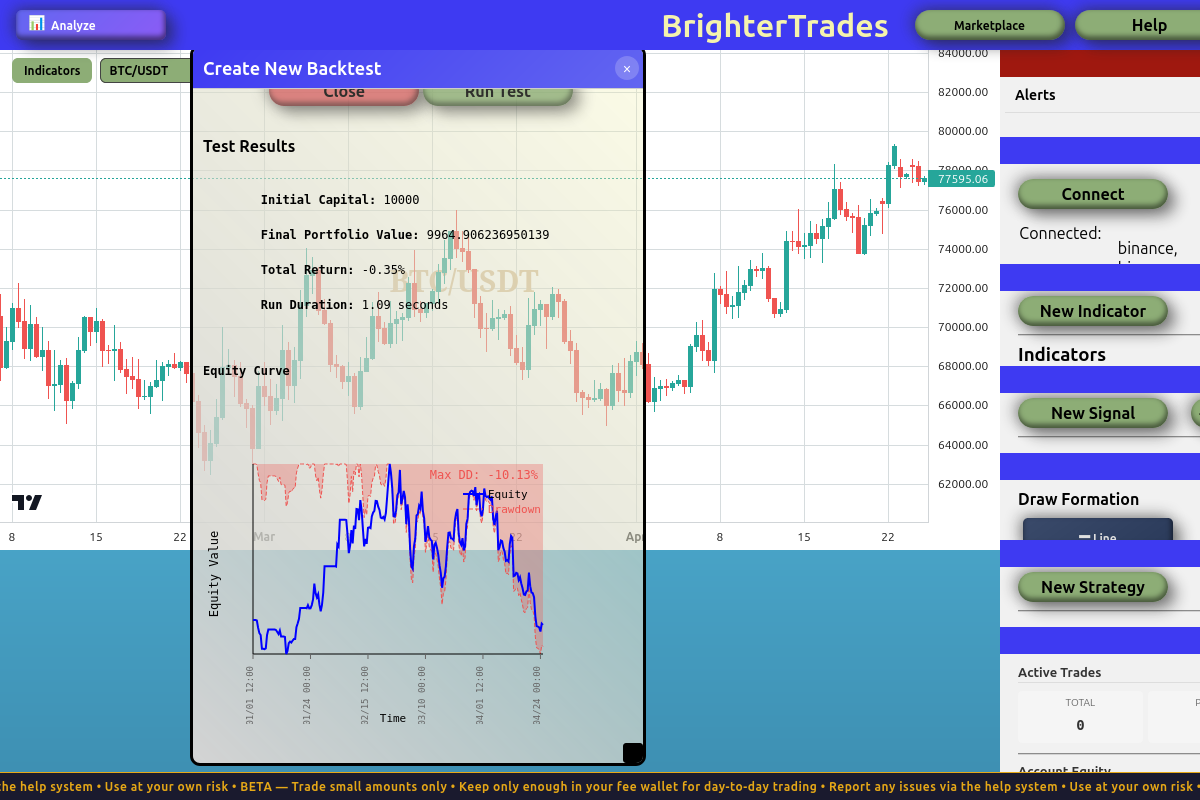
Here's what came back:
| Metric | Value |
|---|---|
| Total Return | −0.35% |
| Number of Trades | 9 |
| Win Rate | 55.56% |
| Win/Loss Ratio | 1.25 |
| Profit Factor | 0.90 |
| Max Drawdown | −10.13% |
| Avg PnL per trade | −$11.64 |
A few things to notice:
The strategy fires. 9 trades over ~4 months — that's a real signal, not noise. The hypothesis isn't garbage.
The win rate is positive. 55.6% of trades are winners. More than half. Sounds great.
But the profit factor is 0.90. This is the key number. Profit factor is total winnings ÷ total losses. A value below 1.0 means you lose more on losers than you make on winners — even with a positive win rate. 0.90 means for every $1 in losses, you only make $0.90 in winnings.
The result: a slightly losing strategy. Win rate alone doesn't determine profitability. Win/loss ratio matters as much.
A strategy isn't about being right more often. It's about expectancy: how much you win on average per trade, given both the win rate AND the win/loss ratio.
expectancy = (win_rate × avg_win) − (loss_rate × avg_loss)
If your wins and losses are roughly the same size, you need a clear win-rate edge. If your wins are much larger than your losses, you can be profitable with a low win rate. If your wins are much smaller than your losses, even a high win rate isn't enough.
So this version of the hypothesis didn't pan out. Now we iterate.
Iteration 1: Replace candle range with ATR
The single-candle range we used as our volatility measure is noisy. The trigger candle could be unusually tiny (and our stop is too tight) or unusually huge (and our stop is too wide). Either way, the stop placement doesn't reflect the asset's typical volatility — just whatever happened in that one candle.
ATR (Average True Range) is a 14-period (by default) average of candle ranges. It smooths out the noise. Same idea, more stable estimate.
Create an ATR indicator
In the right sidebar, click New Indicator. Name it BTC 12h ATR, type ATR, and the exchange/symbol/timeframe should pre-fill to match your strategy. Click Create Indicator.
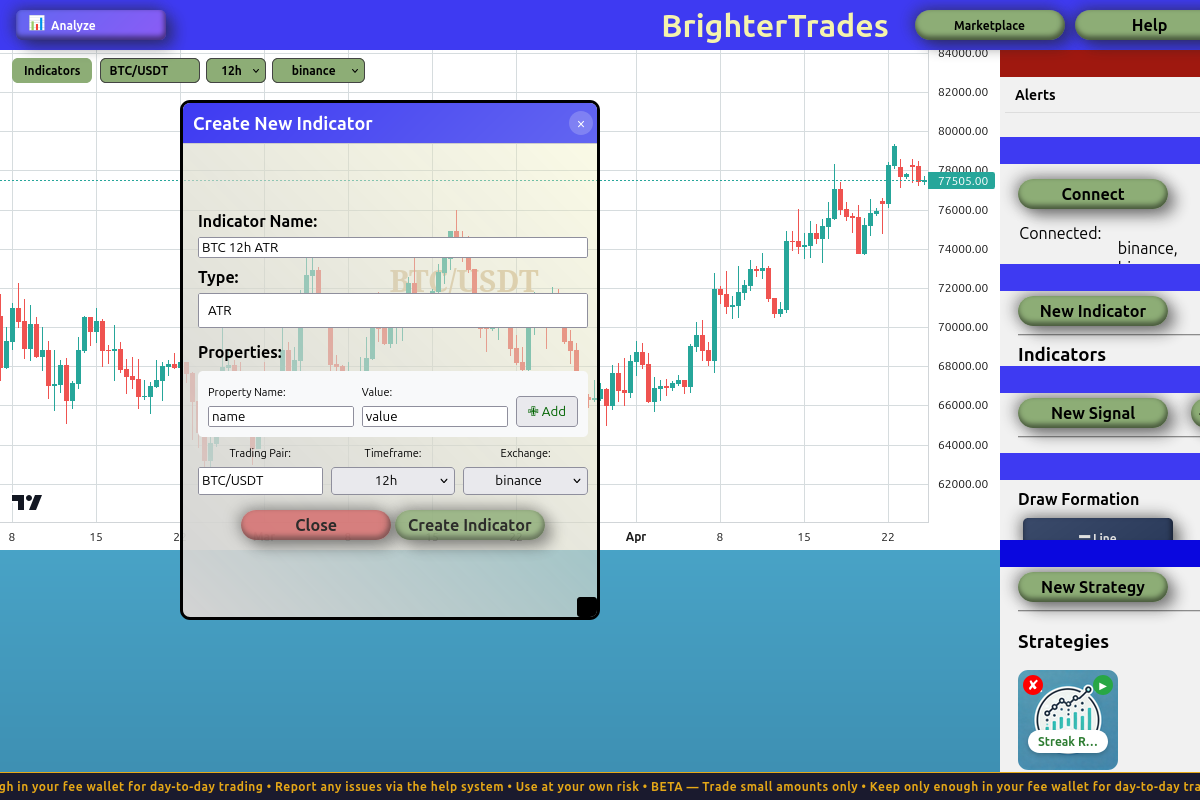
The ATR indicator dialog. The defaults (Binance, BTC/USDT, 12h, period 14) are exactly what we want.
A new pane appears below the price chart showing the ATR line.
Edit the strategy to use ATR
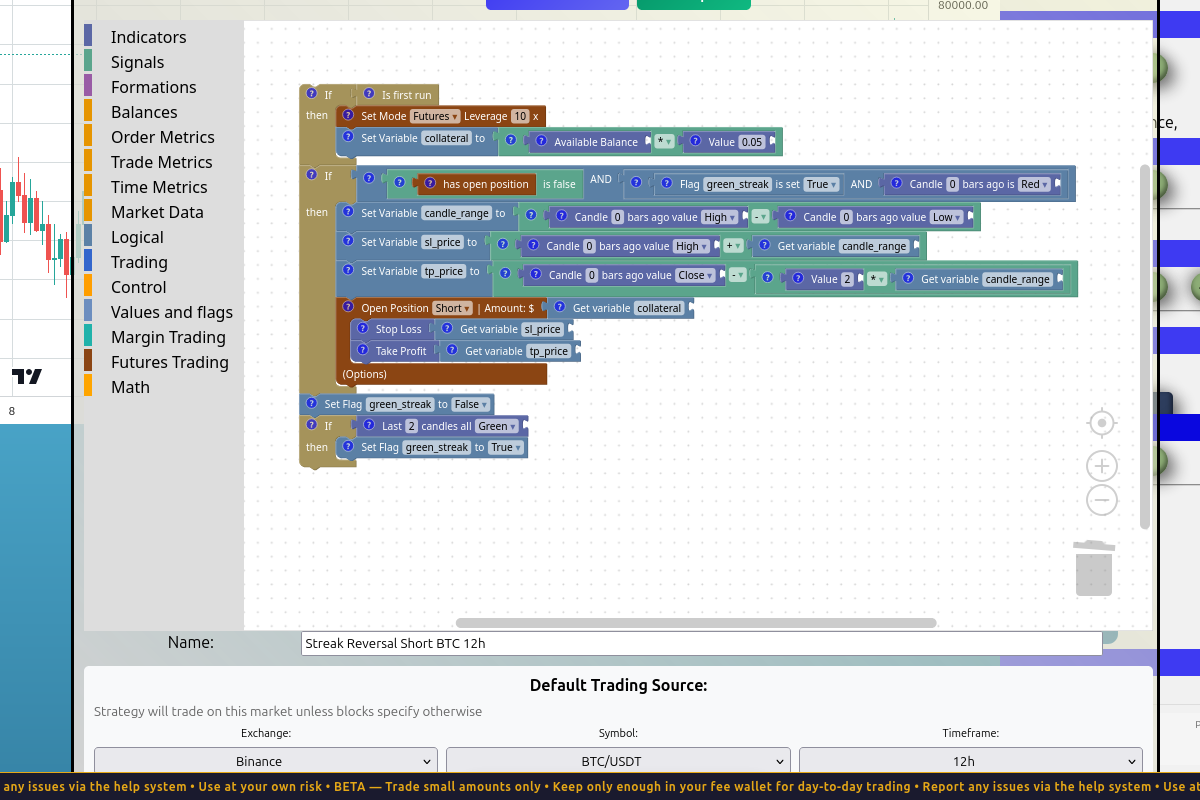
Click on your strategy in the Strategies panel to re-open the editor. Inside the trade body, delete the candle_range calculation entirely — we won't need it. Then update sl_price and tp_price to use the ATR value directly:
- sl_price = high + (ATR × 0.7)
- tp_price = close − (ATR × 4.0)
Wait — those multipliers (0.7 and 4.0) aren't the 1:2 ratio we started with. They give roughly 1:5.7 risk-reward instead. Why?
We tuned them. By trial and error, we found these multipliers gave the best in-sample backtest. Read on.
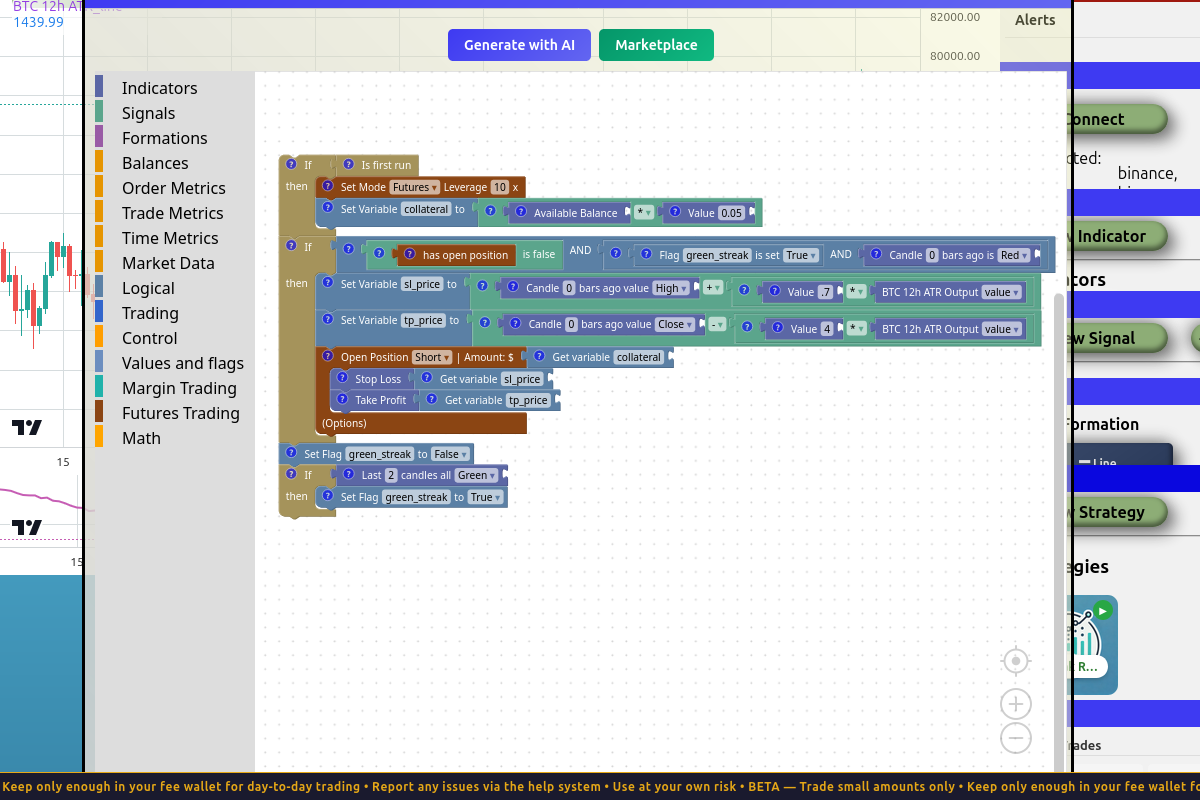
The same strategy with ATR-based stops. SL is 0.7 × ATR above the high; TP is 4 × ATR below the close. The candle_range variable is gone — we don't need it anymore.
Re-run the backtest
Same date range (Jan 1 → now), same capital, same commission:
| Metric | v1 (candle range) | v2 (ATR, tuned) |
|---|---|---|
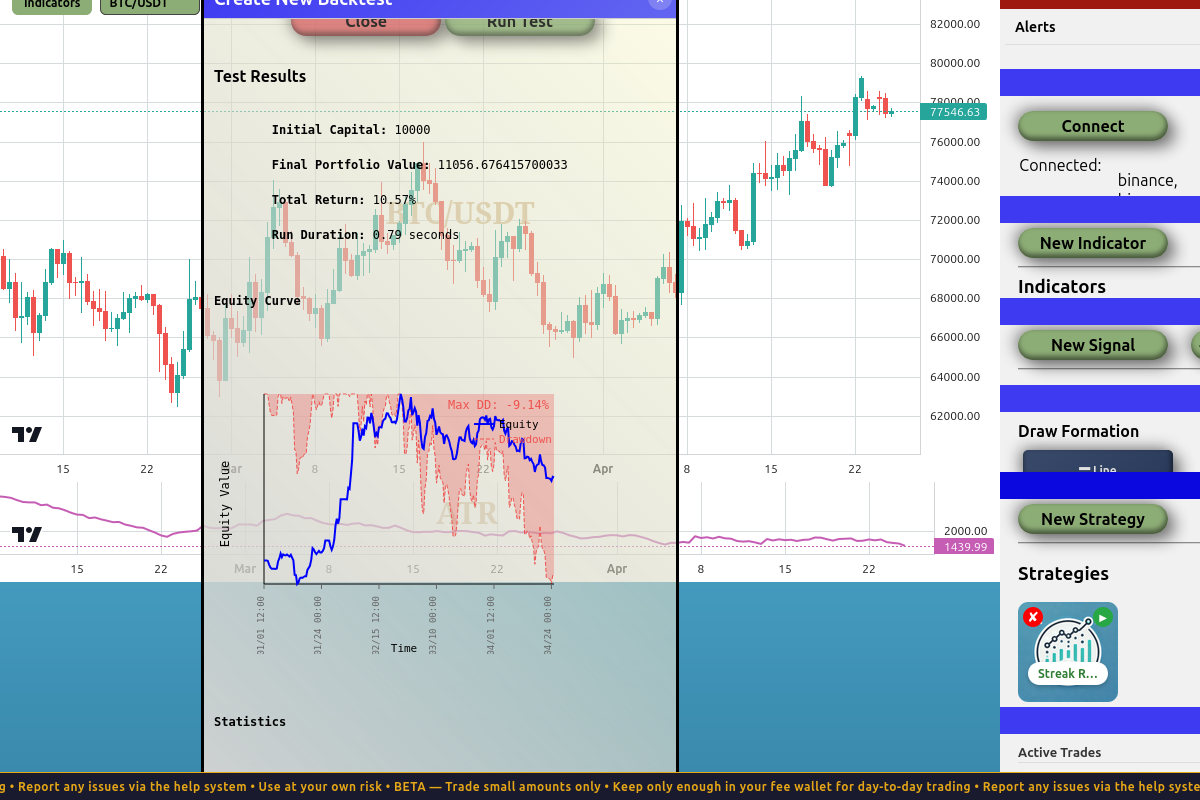
| Total Return | −0.35% | +10.57% |
| Trades | 9 | 8 |
| Win Rate | 55.6% | 50% ↓ |
| Win/Loss Ratio | 1.25 | 1.0 |
| Profit Factor | 0.90 | 2.20 ↑↑ |
| Max Drawdown | −10.13% | −9.14% |
| Avg PnL per trade | −$11.64 | +$132.08 |
Now this is interesting. The win rate went down (55.6% → 50%), but the strategy went from losing to winning. By widening the take profit relative to the stop loss, each winner pays for more losers. Even at break-even win rate, the strategy is profitable because gross profit is 2.2× gross loss.
This is exactly the expectancy lesson from above. Lower win rate, higher win/loss ratio, better outcome.
The honest truth about tuning
We didn't pick 0.7 and 4.0 from theory. We tweaked them until the backtest looked good. That's curve-fitting. Curve-fitting means finding parameters that fit a specific dataset — not parameters that capture a general truth about the market.
The risk: a strategy that's tuned to one period might fall apart on a different period. The "edge" you found wasn't real; it was just noise that happened to favour those specific numbers.
Most retail strategies that "look great" in a backtest were tuned this way. The trader saw a 50% loss in their first month live and concluded the market had "changed." It hadn't — they were never trading a real edge in the first place. They were trading noise that fit their backtest.
Always run an out-of-sample test before believing a backtest.
Out-of-sample testing
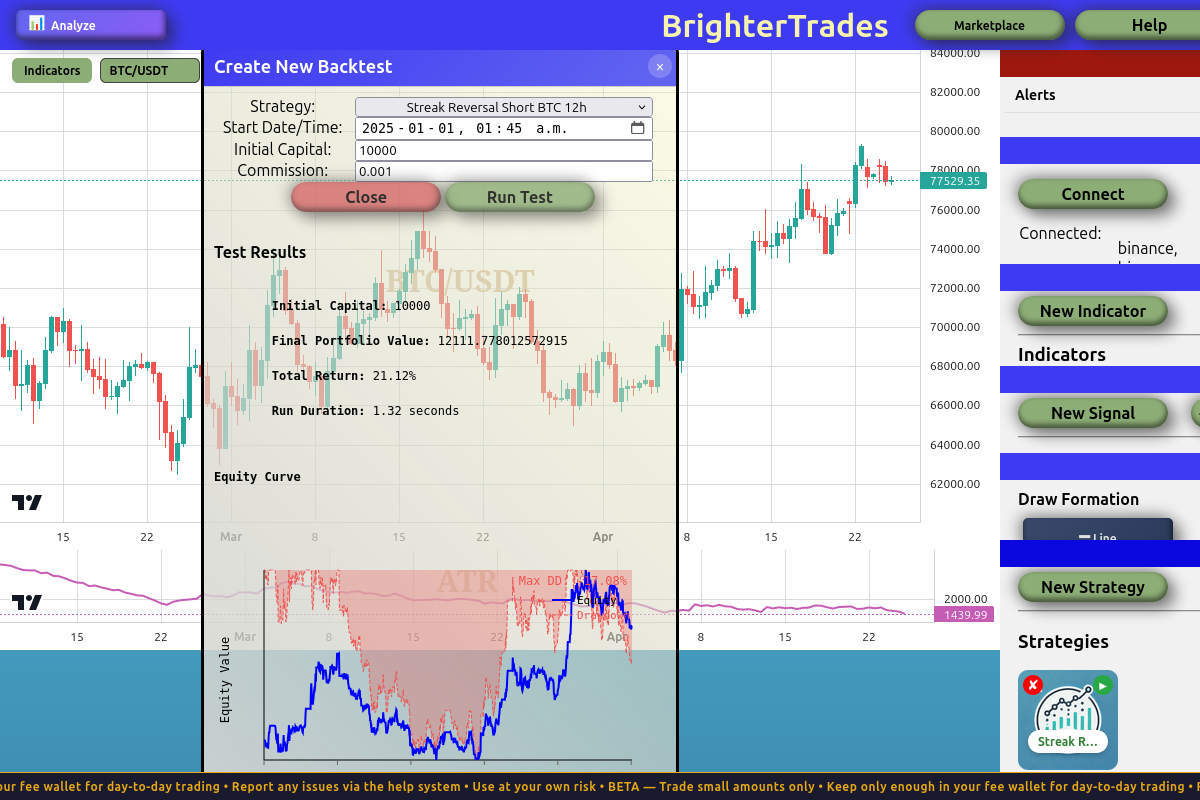
The honest test: run the same strategy with the same parameters on a different time period the strategy wasn't tuned on. We tuned on Jan→Apr 2026. Let's run on Jan 2025 → now (~16 months including the tuning period as a portion of it):
| Metric | In-sample (~4 months) | Out-of-sample (~16 months) |
|---|---|---|
| Total Return | +10.57% | +21.12% |
| Trades | 8 | 31 |
| Win Rate | 50% | 38.71% ↓ |
| Win/Loss Ratio | 1.0 | 0.63 ↓ |
| Profit Factor | 2.20 | 1.48 ↓ |
| Max Drawdown | −9.14% | −17.08% ↑↑ |
| Calmar Ratio | 1.16 | 1.24 |
| Max Consecutive Losses | 2 | 8 |
The strategy survived. Profit factor is still > 1.0. Total return is positive. Most overfit strategies completely break out-of-sample — this one didn't. That's a good sign that there's a real (if small) edge here.
But every quality metric got worse:
- Win rate dropped (50% → 38.7%)
- Win/loss ratio dropped (1.0 → 0.63)
- Profit factor dropped (2.20 → 1.48)
- Max drawdown almost doubled (−9.1% → −17.1%)
- 8 consecutive losing trades at one point — a real psychological test
The +21% over 16 months is roughly 14% annualized. Not amazing, not bad. Better than most savings accounts; worse than holding BTC outright over the same period.
The in-sample numbers were flattering. The out-of-sample numbers are closer to what you'd actually experience trading this live. Always weight the worse number more heavily — that's the honest expectation. If you can stomach a 17% drawdown and 8 losses in a row, this strategy might be worth running. If you'd close it after 4 losses, you'll lock in your loss right before a recovery, and you'd have been better off not running it at all.
What you've built
In this tutorial you went from "I see a pattern on the chart" to "here's a backtested, out-of-sample-tested strategy with realistic performance expectations." Along the way:
- You converted an observation into a concrete rule. No vibes; the rule has specific entry, exit, and sizing criteria.
- You learned the init pattern.
Is first run+execute_ifis how you do one-time setup in BrighterTrading. - You hit a logical contradiction and solved it with state. The flag pattern is a general tool — any time you need to remember something across ticks, this is the shape.
- You ran a backtest, found the strategy unprofitable, and iterated. The first version of any strategy almost never works. Iteration is the whole game.
- You used an indicator. ATR for volatility-based stop sizing; you could swap in any of the other indicators the same way.
- You learned what curve-fitting looks like and how to test for it. Out-of-sample is non-negotiable.
Where to go from here
Before running this strategy in paper mode (let alone live), consider:
- Test on more periods. 2024. 2023. Bear markets vs bull markets. Does it hold up?
- Try other parameter combinations. Maybe
0.5 × ATRfor SL and3 × ATRfor TP works just as well or better. Don't trust a single set of multipliers. - Try other timeframes. Does the streak pattern work on 4h? 1d? 1w? Each timeframe is its own market.
- Try other assets. Does it work on ETH? SOL? Total altcoins? If it only works on BTC, that's suspicious — real edges often generalize.
- Paper trade it. Run it forward in paper mode for a month. Backtest results don't always match live behaviour because backtests assume perfect fills.
- Decide if you can stomach the drawdown. A 17% drawdown means at some point you'll be looking at a $1,700 loss on a $10k account. If that's going to make you turn it off, run it smaller or don't run it at all.
That's the honest workflow. Build, backtest, iterate, out-of-sample, paper, live — in that order, with the discipline to stop at any step where the numbers tell you to.