Building a Multi-Timeframe, Cross-Asset Strategy
The earlier tutorials kept things simple: one chart, one timeframe, one symbol. Real strategies often look at more than that — using a higher timeframe to identify a trend regime, then a lower timeframe to time entries; or using one asset's behavior to inform trades on a different asset.
This tutorial builds a single strategy that does both at once. The hypothesis:
Take ETH long when BTC is in an uptrend and ETH's own momentum is up; take ETH short when BTC is in a downtrend and ETH's own momentum is down. Exit each position when ETH's momentum reaches the opposite extreme.
We'll use BTC's higher-timeframe MACD as the regime filter and ETH's 1-hour RSI as both the timing trigger and the exit trigger. Trades execute on ETH/USDT regardless of which chart you're looking at while building the strategy.
- How to attach an indicator to a specific symbol / timeframe / exchange
- That a single strategy can reference indicators from multiple sources at once
- How the strategy builder's indicator block toolbox surfaces every indicator you've defined, not just ones for the current chart
- Why "Default Trading Source" and the optional "Target market" block on Open Position serve different purposes
Mental model: indicators are independent of the chart
Every indicator you define has its own data source — symbol, timeframe, exchange. You set this when you create the indicator, and it's frozen for that indicator's lifetime. So BTC 12h MACD is always MACD on BTC/USDT 12h, no matter what chart you're looking at when you build a strategy that uses it.
This is the key to multi-source strategies. You can define:
BTC 12h MACD— MACD on BTC/USDT 12hETH 1h RSI— RSI on ETH/USDT 1hETH 4h ATR— ATR on ETH/USDT 4h
…and reference all three from a single strategy. The platform fetches the right candles for each indicator independently and feeds the strategy's logic with values that are aligned to the strategy's own ticking timeframe.
Step 1: define the indicators
For this tutorial we need two:
| Indicator name | Type | Trading Pair | Timeframe | Exchange |
|---|---|---|---|---|
BTC 12h MACD | MACD (default 12/26/9) | BTC/USDT | 12h | binance |
ETH 1h RSI | RSI (default 14) | ETH/USDT | 1h | binance |
Click + New Indicator in the right panel for each. The exact dialog steps:
- Type the name in the Indicator Name field.
- Search for the type (
MACDorRSI) and click it. - Set Trading Pair, Timeframe, Exchange to the values above.
- Leave default properties (you can tweak fast/slow/signal periods later).
- Click Create Indicator.
After saving each one, the right-side Indicators panel may seem empty — that's because the panel filters by the chart's current symbol/timeframe. Switch the dropdown at the top of the panel from Show Focused to Show All and both indicators will appear regardless of which chart is loaded.
When you build a strategy, the Blockly Indicators category in the toolbox lists every indicator you've defined, not just ones for the current chart. That makes cross-source strategies buildable in one editing session.
Step 2: generate the strategy
Click New Strategy in the right panel, then Generate with AI. A detailed prompt should generate a fairly complex strategy, but you may need to edit the result or make adjustments to get it just the way you want it:
Trade ETH/USDT on the 1h timeframe. Use BTC 12h MACD as a higher-timeframe trend filter (uptrend when macd > signal, downtrend when macd < signal). Use ETH 1h RSI for momentum confirmation — go long when BTC is up AND ETH RSI is above 50; go short when BTC is down AND ETH RSI is below 50. Exit longs when RSI rises above 60; exit shorts when RSI falls below 40. Use a stop loss and take profit based on current price. 5% of equity per trade. Futures, 1× leverage, one position at a time.
Before clicking Generate, set the Default Trading Source at the bottom of the dialog to ETH/USDT, 1h, binance. The default source is what gets traded when an Open Position block doesn't specify a market — and it's also the strategy's "ticking" timeframe (one strategy iteration per ETH 1h candle close).
Here's a strategy that matches this prompt:
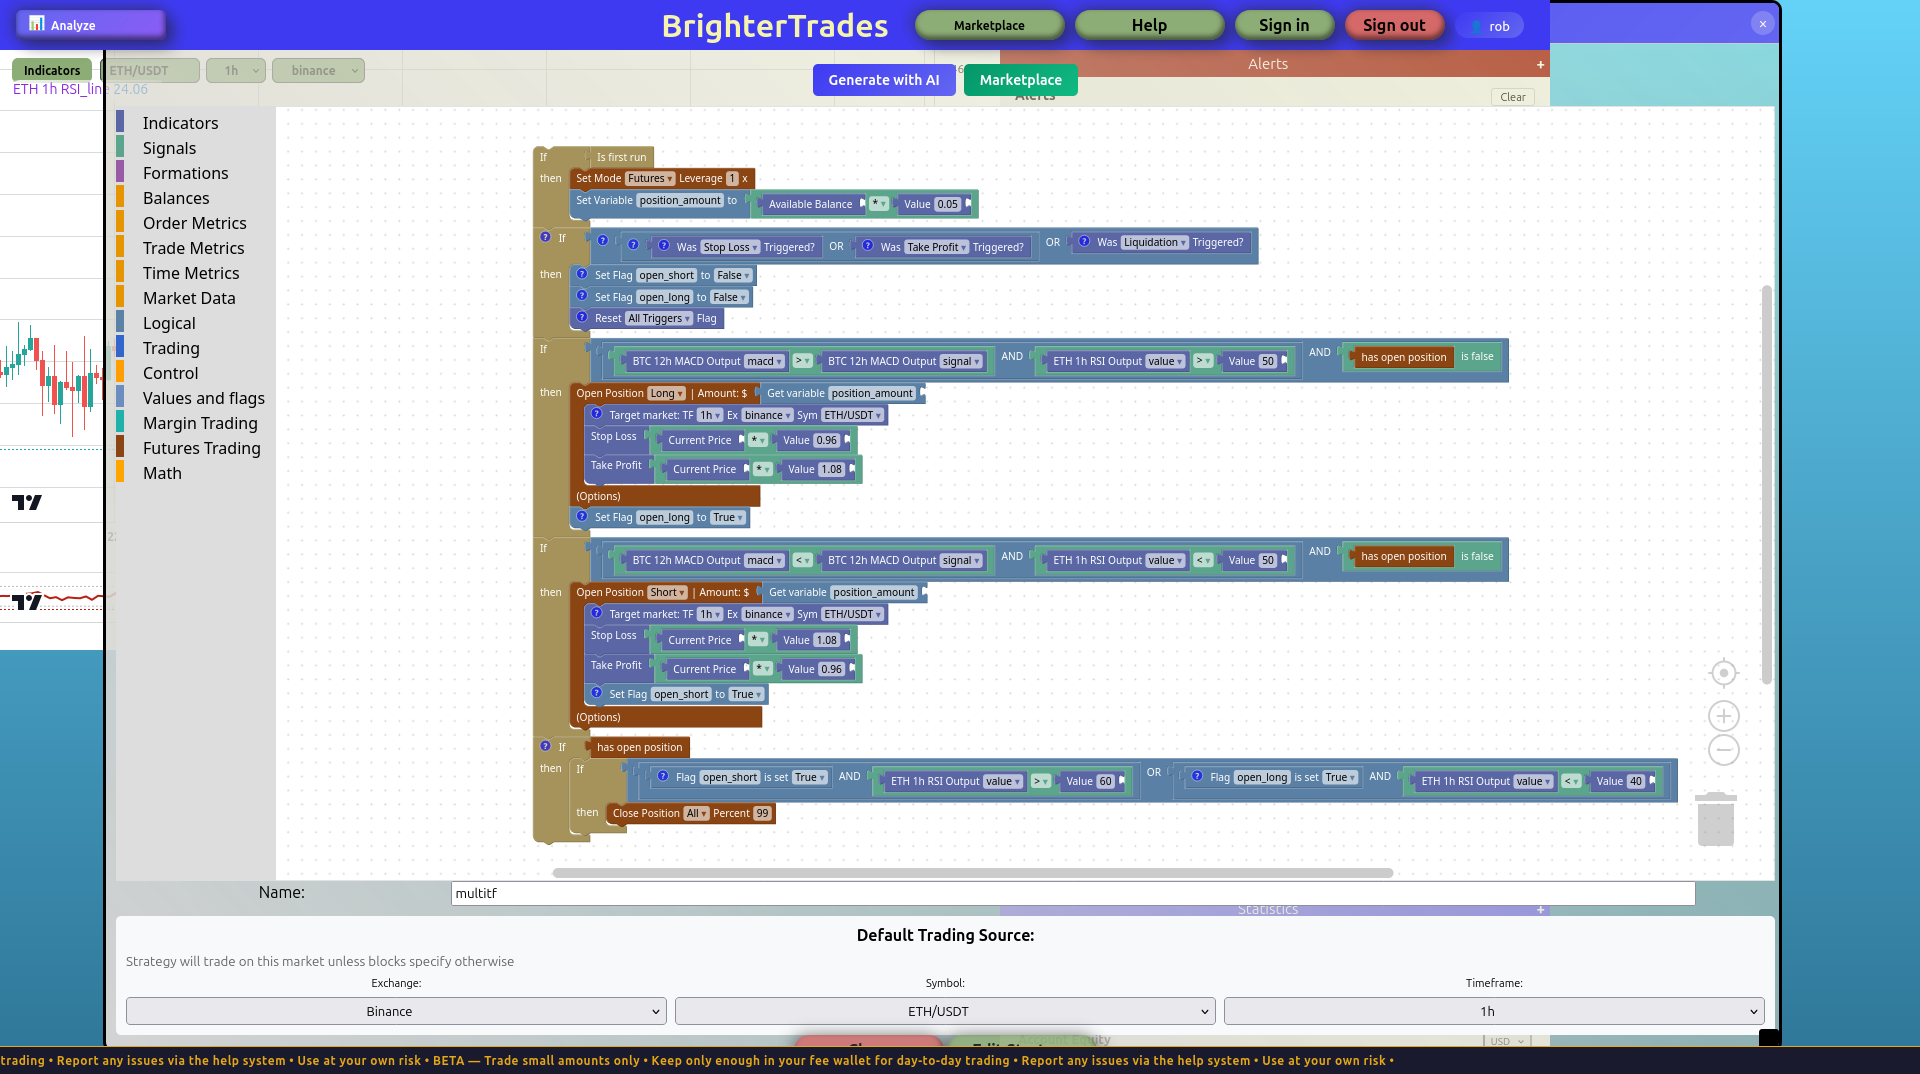
The strategy has the shape we expected:
- Init block sets futures mode at 1× leverage and a position-size variable equal to
Available Balance × 0.05. - Long branch — fires when all of:
BTC 12h MACD Output macd>BTC 12h MACD Output signal(BTC uptrend)ETH 1h RSI Output value> 50 (ETH momentum is up)has open positionis false (one position guard)- Then:
Open Position Long, withStop Loss = current price × 0.985,Take Profit = current price × 1.03.
- Short branch mirrors the long branch with inverted comparisons (BTC downtrend, ETH RSI < 50).
- Exit branches are direction-aware: a long is closed when
ETH RSI > 60, a short is closed whenETH RSI < 40.
The interesting line items aren't the entry rules — those are just RSI/MACD logic any backtested strategy might use. The interesting bit is what data each block reads:
- The
BTC 12h MACD Outputblocks pull from BTC/USDT 12h candles - The
ETH 1h RSI Outputblock pulls from ETH/USDT 1h candles - The
Open Positionblocks place orders on ETH/USDT (the default source, or whatever the Target market specifies)
Three different data sources, one strategy.
When entry and exit conditions overlap on the same indicator region, the position closes the same bar it opens. Example of an overlap:
- Entry:
RSI < 40(oversold, take a long) - Exit:
RSI < 50(close)
If RSI is 35, both conditions are true. The position opens, then closes immediately — entry and close timestamps match, every trade is a tiny round-trip-commission loss, and the equity curve bleeds linearly down.
The fix is to make exit conditions live in a different RSI region than entries — long exits at RSI > 60, short exits at RSI < 40 (as in the strategy above). For more complex logic, gate each exit branch on a position-direction flag so short-exit conditions can't fire while a long is open.
Step 3: Default Trading Source vs Target market
The strategy on this page uses two related but distinct mechanisms to pick which market gets traded:
Default Trading Source — set at the bottom of the New Strategy dialog. This is the strategy's home market. Any Open Position block that doesn't override it places orders here, and this is also the chart whose candle ticks drive the strategy's iteration loop. Without an override, the entire strategy trades on this market.
Target market block — an optional block you can add to an Open Position. It overrides the default source for that specific order, letting one strategy place trades on multiple markets if your logic calls for it. In the screenshot above I added Target market blocks to the Open Position calls explicitly setting them to ETH/USDT 1h binance — this is redundant when the default source is already ETH/USDT 1h, but it makes the intent visible and demonstrates the override mechanism.
When would you actually use Target market? Examples:
- Strategy reads on-chain data on BTC and trades both BTC and ETH based on the same signal.
- Hedge: long on the spot exchange, short on a futures exchange.
- Pair trade: long ETH and short BTC simultaneously when a relative-strength signal fires.
For a single-asset strategy like this tutorial's, Default Trading Source alone is enough. The Target market block is there for when you need it.
Step 4: backtest it
Click Save Strategy, then open the Backtest dialog from the right panel and run it over a few months of historical data. A few things to look for:
- Same-bar thrash. Open the trade log and check the timestamps. If every entry has a matching close on the same timestamp, the exit logic is firing on the entry bar — that's the issue described in the caution above. Fix the exit comparisons before reading anything else into the results.
- Did it actually take trades? If the backtest produces zero trades, the entry conditions are too tight or the indicator data isn't lining up. Check the Show All indicators panel for any with
--as the latest value — that means the indicator hasn't computed. - Was the BTC trend filter active during the test window? If BTC was in a single direction for the whole test period, you'll see only longs (or only shorts). That's not a bug; it just means the test window is short relative to BTC's trend cycle.
- Compare to a "no filter" version. Try regenerating without the BTC trend condition and backtest again. If the BTC filter actually helps, the filtered version's expectancy per trade should be meaningfully higher even if the total trade count drops.
The honest answer about whether this specific strategy is profitable: nobody knows without running multiple out-of-sample tests across different BTC regimes. The point of this tutorial isn't to ship a profitable strategy — it's to show that the expressive shape exists.
What's next
Try variations:
- Use Supertrend instead of MACD for the trend filter — Supertrend has a single
directionoutput (1or-1) that maps cleanly onto buy/sell logic. - Add a third indicator like volatility (ATR on ETH 1h) and gate position size by it: smaller positions when ATR is high.
- Try BTC 4h instead of 12h for the trend filter — faster regime switches, more trades, more noise.
Each of those changes is a single indicator definition + a few block tweaks. The cross-source machinery does the work; you just declare the data sources you want.